Algorithmic Power Attribution: Profiling Energy Consumption Across Individual Multi-Core MCU Tasks
14 September 2026 · Lance Harvie
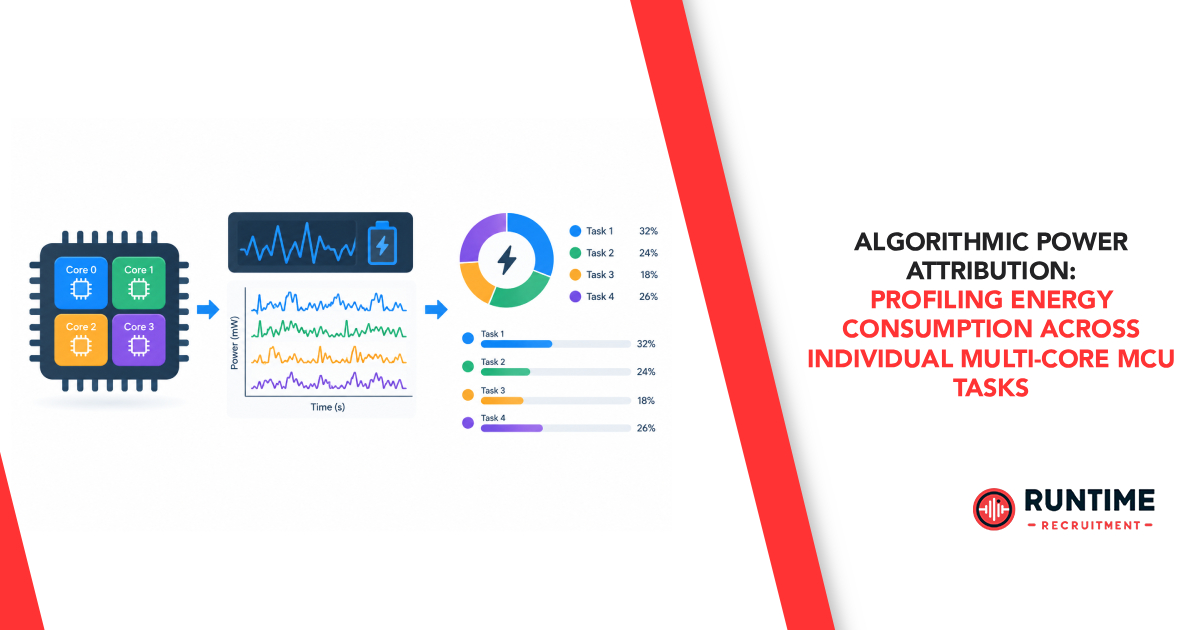
The Multi-Core Energy Paradox
Multi-core microcontrollers (MCUs) — such as dual-core ARM Cortex-M33 architectures, asymmetric Cortex-M4 and Cortex-M0+ pairings, and multi-core RISC-V devices — have fundamentally reshaped modern embedded systems design. By decoupling real-time control loops from heavy mathematical compute, digital signal processing, or wireless protocol stacks, these multi-core silicon designs allow firmware developers to maximize execution throughput while scaling down dynamic operating frequency. However, this architectural leap introduces a major engineering hurdle: traditional energy profiling methods completely fall apart in multi-core environments.
In a classical single-core bare-metal or single-core real-time operating system (RTOS) architecture, calculating energy consumption is conceptually simple. Because code execution is strictly serial, a developer calculates overall energy by integrating measured current over time and multiplying it by the rail supply voltage. Any localized spike in current directly correlates with whatever specific software instruction, loop, or task is executing on that single CPU core at that exact microsecond.
In a multi-core RTOS environment, this direct physical correlation breaks down entirely. Consider a scenario where Core 0 executes an active Fast Fourier Transform (FFT) algorithm while Core 1 concurrently processes a background Bluetooth Low Energy (BLE) connection event and incoming sensor data over I2C. A physical current probe placed on the main voltage supply rail measures only the aggregate sum of system power. The physical test hardware cannot natively determine which core — or specifically, which software thread, task, or Interrupt Service Routine (ISR) running on those cores — is responsible for a given milliampere of current draw.
Consequently, macro-level energy measurements mask localized software inefficiencies. An energy-hungry spin-lock, an improperly duty-cycled hardware timer, an inefficient polling loop, or a cache-thrashing thread can easily hide within the baseline power footprint of an active secondary core. To achieve true energy optimization in modern firmware, engineering teams must move beyond global current measurement and adopt Algorithmic Power Attribution: the systematic decomposition of physical system current into discrete, task-level energy profiles across multiple concurrent processing cores.
Physics and Mechanics of Multi-Core Power Breakdown
To isolate power down to individual software threads, firmware developers must first understand the distinct physical mechanisms that dictate an MCU’s instantaneous power consumption.
The total dynamic and static power drawn from the primary power rail is composed of four main elements: static leakage power, independent core dynamic power, shared interconnect infrastructure power, and peripheral activity power.
Static leakage power is dictated by process node physics, operating temperature, and supply voltage. It remains present even when CPU cores are clock-gated or placed into deep sleep states.
Dynamic power for each individual CPU core is driven by active transistor switching logic. This energy consumption is directly proportional to the capacitance of the core’s clock tree, the square of the supply voltage, the active operating frequency, and the instruction-dependent switching activity factor. For instance, executing SIMD or vector math instructions activates significantly more internal gate switching than simple NOP instructions, register moves, or memory load operations, causing instantaneous core power to fluctuate dramatically based on the nature of the instructions being executed.
Shared infrastructure power accounts for multi-layer AHB or AXI bus interconnects, crossbar switches, shared level-two caches, and multi-port SRAM banks. When Core 0 and Core 1 attempt to access shared memory concurrently, the bus crossbar incurs switching overhead that cannot be cleanly assigned to either core without software context tracking.
Peripheral activity power includes the dynamic energy consumed by integrated hardware modules — such as Direct Memory Access (DMA) channels, hardware cryptographic accelerators, Analog-to-Digital Converters (ADCs), and radio transceivers — that are triggered by software tasks but execute asynchronously alongside the main CPU cores.
The primary objective of task-level power attribution is to mathematically express total system power as a combination of baseline hardware static costs, active task states across all cores, and non-linear power penalties. These non-linear penalties arise from bus crossbar stalls, memory access contention, or shared resource locking when multiple cores simultaneously contend for the same memory bus or peripheral block.
Hardware and Tracing Infrastructure
Attributing overall power consumption to individual tasks requires coupling high-resolution physical current sensing with cycle-accurate, non-intrusive software execution tracing.
High-bandwidth physical current acquisition demands specialized test equipment. Standard digital multimeters or low-cost current loggers sample at low frequencies ranging from ten hertz to one kilohertz, averaging out microsecond-scale current transients and masking critical behavior. Modern multi-core MCUs switch internal power states in nanoseconds. Capturing real-time task context switches requires an energy profiling acquisition front-end with sampling frequencies of at least one mega-sample per second to resolve sub-microsecond RTOS context switches. Furthermore, the measurement hardware must feature a wide dynamic range, utilizing multi-shunt or auto-ranging current sense amplifiers capable of capturing sub-microamp sleep currents up to hundreds of milliamperes during peak active compute without causing voltage drops that could trigger system brownouts. High-speed power analyzers such as the Keysight N6705C, STLINK-V3PWR, or Nordic Power Profiler Kit II represent typical hardware tools used for this level of data collection.
Alongside physical current measurement, developers must capture non-intrusive execution trace data. Modern hardware debug extensions built directly into the silicon core make this possible. On ARM Cortex-M devices, the Instrumentation Trace Macrocell (ITM) allows software to emit low-overhead hardware trace packets over a Single Wire Output (SWO) pin or a four-bit Trace Port Parallel Interface. For full instruction-level visibility, the Embedded Trace Macrocell (ETM) provides complete, cycle-accurate execution tracing. Similarly, RISC-V architectures utilize standardized Nexus or N-Trace hardware interfaces to stream core states, instruction execution, and task context messages without introducing software execution delays.
The primary hardware challenge in physical energy profiling is time-skew alignment between two independent clock domains: the external ADC sampling clock of the power analyzer and the internal target MCU debug trace clock. If the current measurement stream leads or lags the execution trace data by even ten microseconds, high-current spikes generated by a compute-heavy task will be incorrectly attributed to adjacent tasks or RTOS kernel overhead. Resolving this issue requires hardware-assisted synchronization signals, such as toggling a dedicated GPIO pin on a trace start packet or using hardware sync pulse triggers to lock the time origins of both measurement streams simultaneously.
Context-Aware RTOS Instrumentation
To feed the attribution algorithm, the real-time operating system — whether FreeRTOS, Zephyr, ThreadX, or CMSIS-RTOS2 — must expose context switches across all cores in real time.
In FreeRTOS, for example, kernel context switch macros can be instrumented within system configuration files. When operating on a multi-core Symmetric Multiprocessing (SMP) or Asymmetric Multiprocessing (AMP) architecture, the trace hook must output both the Core ID and the active Task Identifier over a designated hardware trace stimulus port whenever a task is swapped in or out.
C
// Example Instrumentation in FreeRTOS Kernel Trace Hook
#define traceTASK_SWITCHED_IN() \
do { \
uint32_t core_id = rtos_get_current_core_id(); \
uint32_t task_id = (uint32_t)pxCurrentTCB->uxTCBNumber; \
/* Write Core ID and Task ID to ITM Port 31 */ \
ITM->PORT[31].u32 = (core_id << 24) | (task_id & 0x00FFFFFF); \
} while (0)
By streaming these encoded thirty-two-bit packets out of the hardware trace port, an external trace analyzer records a precise series of timestamped task boundary events containing the exact time, active core ID, task ID, and context action.
A major pitfall in power attribution involves handling the RTOS Idle Task. When a core has no ready tasks to execute, the scheduler transitions to the Idle Task, which typically executes a low-power wait-for-interrupt instruction to clock-gate the core. In tickless idle modes, the system disables periodic tick interrupts and places the entire microcontroller into a deep sleep state. The power profiling system must strictly separate true idle leakage power from active task power. Assigning deep sleep baseline energy consumption to the last active task will artificially inflate that task’s calculated power footprint and skew optimization metrics.
Additionally, Interrupt Service Routines (ISRs) introduce attribution ambiguity because they preempt standard RTOS tasks without involving the standard task scheduler hooks. If a high-frequency DMA or ADC interrupt fires every fifty microseconds and executes for ten microseconds, it consumes significant energy. Without ISR-aware hardware trace instrumentation, this energy consumption is incorrectly charged to whichever background task happened to be preempted. To resolve this, hardware trace profilers must capture low-level exception trace packets, logging the exact microsecond entry and exit points for every interrupt vector.
Algorithmic Power Attribution Models
Once hardware tools log synchronized time-series current data alongside context switch trace data, mathematical models process the dataset to isolate per-task power draw.
The first approach is the Time-Weighted Discretization Model, which works well for non-overlapping execution or simple AMP systems where cores operate independently. In this model, the energy of a specific task over a profiling window is calculated by isolating the time intervals where that task was active, subtracting the baseline static hardware power from the measured total current during those intervals, and integrating the net current over time.
The second approach is the Multi-Core System Deconvolution Model, which uses matrix regression to handle complex multi-core environments where tasks run concurrently across multiple cores. When Core 0 runs a wireless stack while Core 1 runs an encryption engine, simple time integration cannot separate the individual contributions of each task. To solve this, the profiler divides the continuous execution timeline into small discrete time windows. For each window, the total measured average current is represented as a linear combination of the unknown characteristic current of each task, weighted by the fraction of time each task was active during that specific window, plus an error term accounting for bus contention and measurement noise.
By expressing this relationship across hundreds of consecutive time windows, the profiler creates a system of linear equations represented by a task activity weight matrix multiplied by an unknown task current vector. Using Non-Negative Least Squares regression — which enforces the physical reality that software tasks cannot consume negative current — the algorithm solves for the individual characteristic current profile of every task in the system.

Practical Workflow for Firmware Engineers
Implementing algorithmic power attribution within an engineering organization transforms how firmware developers diagnose, track, and resolve power efficiency issues throughout the development lifecycle.
First, developers establish a baseline power map. This involves measuring static quiescent current across all MCU low-power states — such as stop, standby, and battery backup modes — along with base peripheral operational states like active phase-locked loops, internal clocks, and flash memory power banks. This establishes the system’s baseline static overhead.
Second, engineering teams integrate high-speed current sensing and hardware tracing into continuous integration Hardware-in-the-Loop (HIL) automated test rigs. Running nightly automated test suites with trace generation enables automated build systems to produce detailed per-task energy reports for every new firmware commit, catching energy regressions before code is merged into main production branches.
Third, firmware engineers use the attributed task energy matrix to guide targeted optimizations:
High Energy with Low CPU Utilization: Indicates that a task is leaving a high-power hardware peripheral — such as an internal cryptographic accelerator, fast ADC, or radio transceiver — powered on while waiting synchronously for an event or thread signal.
High Energy with High CPU Utilization: Points to algorithmic inefficiency, such as unoptimized memory access patterns that cause frequent cache misses, bus crossbar stalls, or repeated mutex contention between cores.
Strategic Task Placement: Guides decisions regarding thread placement across heterogeneous cores, such as offloading continuous sensor processing routines from a high-power primary core to an energy-efficient secondary core.
By transitioning from macro-level current logging to algorithmic task-level power attribution, embedded firmware engineers gain the exact architectural visibility necessary to squeeze maximum operational efficiency and battery lifetime out of multi-core microcontrollers.
Looking to advance your career or build elite embedded engineering teams? Connect with RunTime Recruitment—specialists in matching top-tier embedded systems talent with innovative technology companies.